

Prometheus
Pulse connects to a Prometheus-compatible metrics endpoint as a data source. It scrapes the endpoint on its own cadence, stores the returned time series as data points, and makes them available for conditions and charting.
Adding a Prometheus Data Source
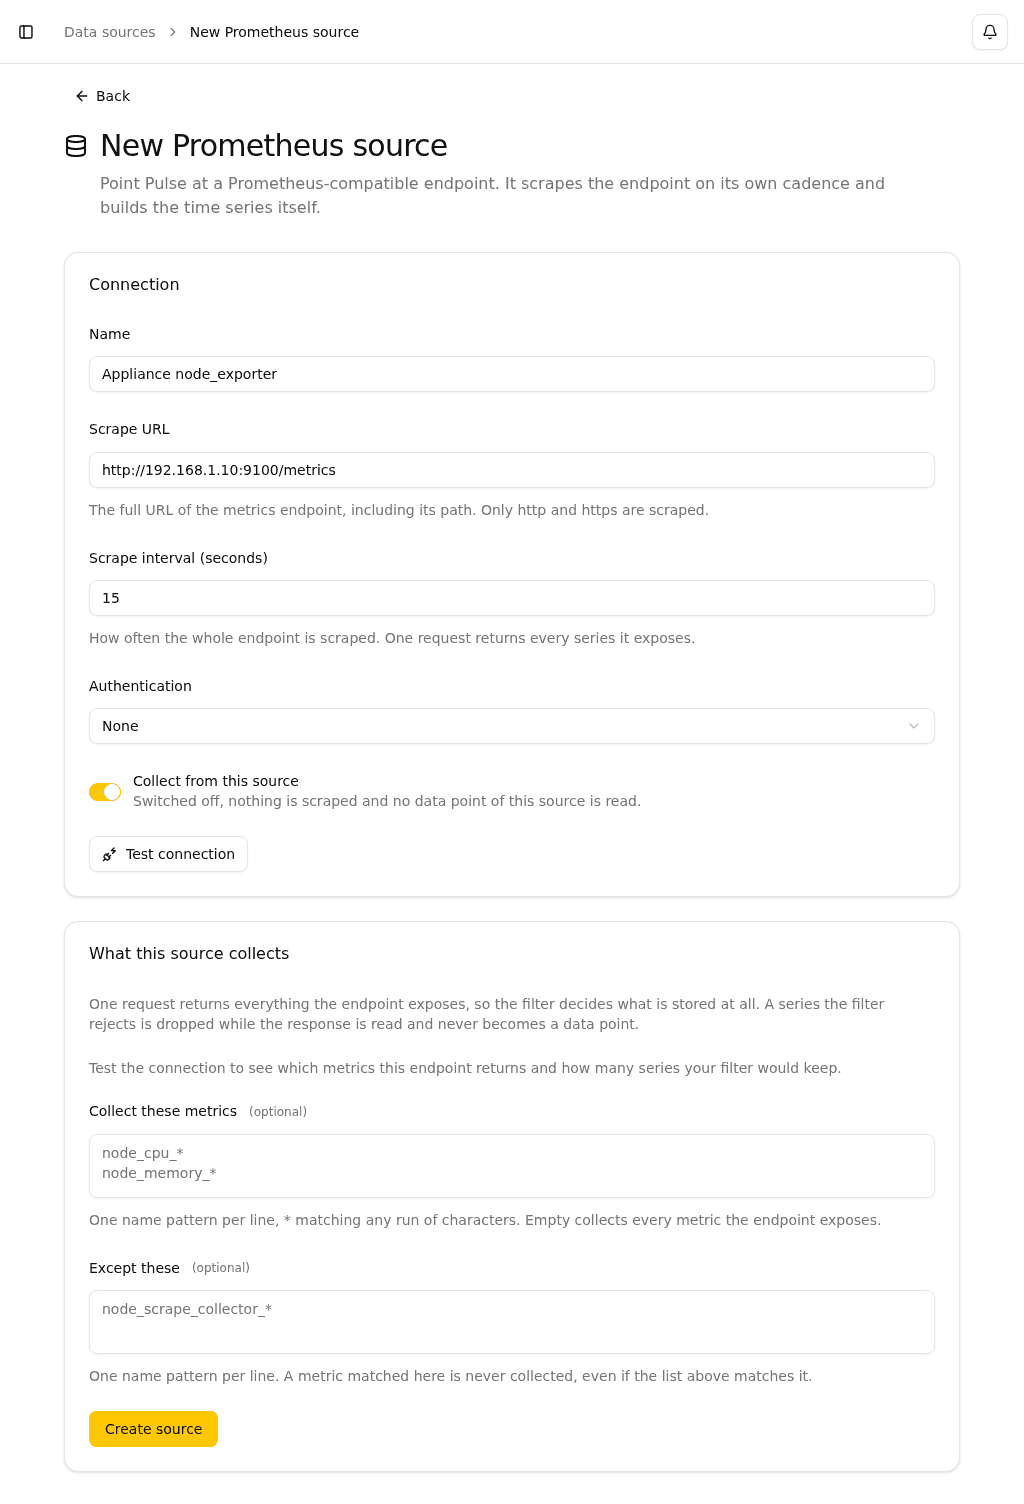
- Navigate to Data sources → Prometheus in the sidebar and click New data source
- Select Prometheus
- Configure the source:
| Field | Description | Example |
|---|---|---|
| Name | A descriptive name for the source | Appliance node_exporter |
| Scrape URL | The full URL of the metrics endpoint, including its path | http://192.168.1.10:9100/metrics |
| Scrape interval (seconds) | How often the endpoint is scraped; one request returns every series it exposes | 15 |
| Collect from this source | Switch this off to stop scraping without deleting the source | |
| Authentication | How Pulse authenticates to the endpoint (see below) |
Authentication
Three modes are available:
| Mode | When to use |
|---|---|
| None | The endpoint is open or protected by network controls |
| Bearer token | The endpoint requires an Authorization: Bearer <token> header |
| Basic auth | The endpoint requires a username and password |
Secrets (tokens and passwords) are stored write-only: Pulse never displays them again after saving. Leave the field blank when editing to keep the stored secret; enter a new value to replace it.
Testing the connection
Click Test connection before saving. Pulse scrapes the endpoint once and reports how many series across how many metrics it found. This step is important: one scrape request may return hundreds of series, and you want to see what you are keeping before it starts accumulating.
What this source collects
Every Prometheus scrape returns every series the endpoint exposes. The metric filter decides which of those series are stored as data points; series the filter rejects are dropped while the response is read and never become data points or consume storage.
The filter has two lists:
| List | Behaviour |
|---|---|
| Collect these metrics | One name pattern per line. * matches any run of characters. Leave empty to collect every metric the endpoint exposes. |
| Except these | One name pattern per line. A metric matched here is never collected, even if the collect list above matches it. |
After you run Test connection, the filter panel shows a live count of how many series your current filter would keep out of the total returned. Adjust the patterns and watch the count move before you save.
Start broad, then narrow
Leave the filter empty on first save, browse what the source collects on its detail page, and then edit the source to add a deny list for the series you do not need. This is easier than writing patterns blind against metrics you have never seen.
Data points and history
Once a source is collecting, each distinct time series becomes a data point visible on the source's detail page. The page shows:
- The metric name and any labels
- The last value read and when it was read
- Whether the reading quality is Good, Bad, or No data
Data points build up a history only while you keep them. Use Keep on the source's detail page for the series you want to chart or query over the long term; the rest remain readable for 24 hours and are then dropped.
Alerting on a value
To alert when a Prometheus metric crosses a threshold, build a condition using a Sensor node pointed at the data point. A condition can combine several data points in one rule — for example, alert when CPU usage climbs above the learned normal level.
Metric types
Pulse stores Prometheus metric types as they arrive and makes them available for querying:
| Type | Description |
|---|---|
| Counter | A monotonically increasing counter; use a Rate of increase node in a condition to convert it to a per-second rate |
| Gauge | A value that can go up or down |
| Histogram | A sample distribution with count, sum, and bucket series |
| Summary | A pre-computed quantile distribution |
| Untyped | Metrics the endpoint did not type |