

Incidents
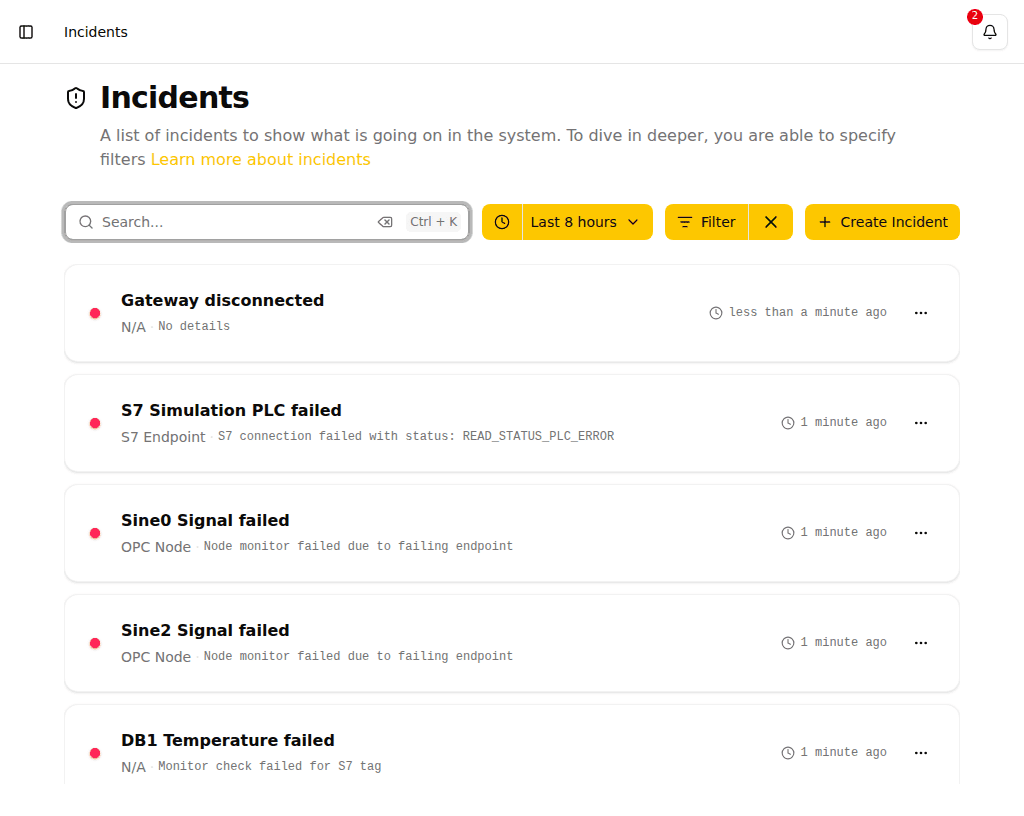
Incidents represent a period of degraded or failed service that requires attention. They are created automatically when a monitor detects a problem, or manually by a team member.
Incident Lifecycle
Every incident follows a defined lifecycle:
- Unacknowledged -- The incident has been detected but no one has responded yet. Shown with a red Unacknowledged badge.
- Acknowledged -- Someone has seen the incident and is working on it. Shown with an amber Acknowledged badge.
- Resolved -- The underlying issue has been fixed. Shown with a green Resolved badge.
Creating an Incident Manually
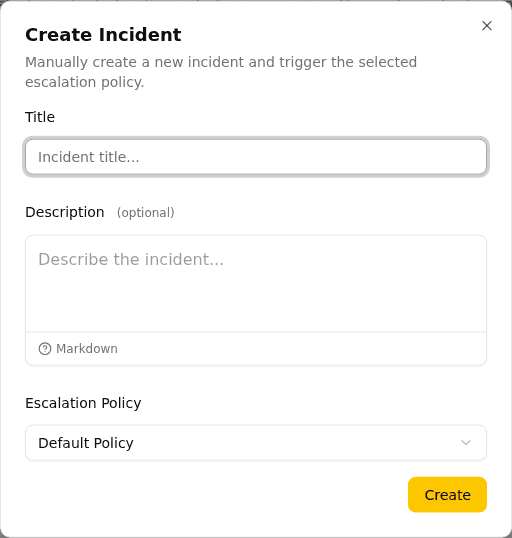
You can manually create an incident from the incident list page. This is useful when you need to trigger an escalation policy for a situation not detected by a monitor.
To create a manual incident:
- Open the Incidents page.
- Click the Create Incident button in the toolbar. On mobile, this button appears as a floating action button fixed at the bottom-right corner of the screen.
- Fill in the form:
- Title (required) — A short description of the incident.
- Description (optional) — A detailed description, supports Markdown.
- Escalation Policy (required) — The escalation policy to trigger. The first available policy is pre-selected.
- Click Create.
The incident is immediately created and the selected escalation policy is triggered. You can then acknowledge and resolve it like any other incident.
Viewing Incidents
The incident list shows all incidents with filtering by status. By default, active incidents (Unacknowledged + Acknowledged) are shown.
The sidebar shows a count badge on Incidents when there are active incidents (unacknowledged or acknowledged) open in your organization, and a separate badge on My Incidents for incidents you have acknowledged but not yet resolved. Badges refresh every minute; they are hidden when the count is zero. When the sidebar collapses to icon-only mode each badge shrinks to a small dot to signal that attention is needed.
The My Incidents sidebar entry is a shortcut that opens the incident list pre-filtered to incidents you have acknowledged — a quick way to see what you are actively working on.
- Search -- Find incidents by title or associated monitor name
- Status Filter -- Toggle visibility of each status type
- Incident Type -- Filter by how the incident was triggered: monitor failure, system incident, or manual incident
- Monitor Type -- Filter by the type of monitor that triggered the incident (Heartbeat, CVE, Trigger, Condition, Objective)
- Tags -- Filter by tags assigned to the monitor that triggered the incident
- Escalation Policy -- Filter by the escalation policy the incident is escalating under. This reflects the policy in use at the time the incident was raised, not any policy later reassigned to the monitor.
- Acknowledged By -- Filter by the team member who acknowledged the incident. Select (me) to show incidents you acknowledged.
- Resolved By -- Filter by the team member who resolved the incident. Select (me) to show incidents you resolved.
- Time Range -- Filter incidents by a time window. Click the clock icon to open the picker. Choose a quick preset or set a custom date and time range. Future dates cannot be selected.
- Auto-Refresh -- The list automatically refreshes every 5 seconds
On mobile, the search field is hidden by default — tap the search icon in the toolbar to reveal it. Tapping the icon again collapses the field and clears any active search.
On mobile, the filter controls are replaced by a Filter button that opens a bottom drawer. All filter groups (Status, Incident Type, Monitor Type, Tags, Escalation Policy, Acknowledged By, Resolved By) appear as expandable sections inside the drawer. Each section shows a count badge when filters are selected. Tap Apply to activate the selected filters or Reset to clear all draft selections. Active filters appear as read-only chips below the search bar; to change a selection, open the drawer again.
Each incident card in the list shows its status badge, monitor type, the tags assigned to the triggering monitor, and a brief cause. When the cause is identical to the incident title — common for simple monitor alerts — the cause line is omitted to reduce repetition.
Incident Details
Click on an incident to see its full details.
The detail page includes:
- Status -- Current incident state, shown as a colored text badge
- Related Monitor -- Link to the monitor that triggered the incident
- Timestamps -- When the incident started, was acknowledged, and resolved
- Acknowledged By -- Which user acknowledged the incident. Click the name to filter the incident list to all incidents they acknowledged.
- Resolved By -- Which user resolved the incident. Click the name to filter the incident list to all incidents they resolved.
- Other Occurrences -- Earlier incidents raised by the same condition (see below)
- Activity Feed -- Chronological log of all events
Other Occurrences
When the same monitor condition has raised incidents before, a card appears above the Activity Feed listing those earlier occurrences. Each row links to that incident and shows when it started and how long it lasted (or still open if it has not been resolved). The section only appears when at least one earlier occurrence exists.
Activity Events
The activity feed records events such as:
- Incident started
- Incident reopened (alert fired again within the reopen window configured on the escalation policy)
- Acknowledged by a specific user
- Resolved by a specific user
- Monitor failure details
- Monitor recovery details
- Email notifications sent
- SMS notifications sent
- Push notifications sent
- Voice call notifications sent
- Voice call ringing (attempted)
- Voice call declined
- Voice call not answered
- Alert email opened by a specific user
- Escalation paused — outside operating hours (shows the time escalation will resume)
- Sender timestamp changed (a later delivery for the same trigger alert carried a different source timestamp)
- Manually escalated to specific users, teams or on-call schedules (see below)
Source timestamp on trigger incidents — When a trigger monitor has a Source timestamp rule configured and the sending system includes a timestamp in the payload, the Incident started and Incident reopened events in the activity feed show the time the sender claimed the alert fired. Alongside it, the feed shows how far that time differs from when Pulse actually received the delivery — for example, "12 minutes before Pulse received it" or "3 minutes after Pulse received it — check the sender's clock". This is evidence about the sender's clock; it never changes when Pulse considers the incident to have started. See Trigger Monitor for how to configure source timestamp extraction.
Description on trigger incidents — When a trigger monitor's Incident description rule extracts text from the webhook payload, that text is shown on the incident detail page rendered as Markdown. A paging system's alert body often contains prose — links to the runbook, a list of affected assets, context that does not fit a title — and Markdown lets that formatting come through. When the description and the cause would say the same thing, the cause subtitle is hidden to avoid repeating it.
Escalating an Incident Manually
Sometimes the right people are not the ones the escalation policy would page next — an operator sees an alarm and knows the electrical maintenance team has to handle it, or has already acknowledged an incident and needs to pull in a specialist. Escalate sends a direct, immediate notification to people you choose.
To escalate an incident:
- Open the incident detail page.
- Click Escalate… (available until the incident is resolved — also on acknowledged incidents).
- Pick one or more users, teams or on-call schedules. A team notifies all of its current licensed members; an on-call schedule notifies whoever it puts on call at that moment.
- Tick the channels to alert them by: Call, SMS, E-mail, or Push notification. E-mail and push are pre-selected.
- Click Escalate.
The chosen recipients are notified immediately, with a note naming who escalated to them, and the escalation is recorded on the activity feed together with the notifications that went out.
A few things to know:
- Manual escalation is additive: the automatic escalation policy keeps running on its own schedule until someone acknowledges the incident. Escalating never silences the policy.
- A manual escalation reaches the chosen people even outside their configured operating hours — it is a deliberate, named page.
- Recipients of a manual escalation also receive the follow-up notifications when the incident is later acknowledged and resolved.
- The activity feed names the on-call schedule you escalated to, not the people it resolved to — who was on call at that moment is visible in the notification entries that follow it.
Push Notifications
When an incident is created and an escalation step with push notifications enabled is triggered, recipients receive a push notification on their registered devices. When the incident is later resolved, those same recipients receive a follow-up push notification confirming the resolution.
Comments
You can add comments to an incident's activity feed to share updates, context, or next steps with your team.
To add a comment:
- Open the incident detail page.
- Click Add Comment.
- Write your comment — Markdown is supported, including task list checkboxes (
- [ ] item,- [x] done). - Click Submit.
The comment appears in the activity feed, visible to all team members.
Actions
From the incident detail page, you can:
- Acknowledge -- Mark the incident as seen and being worked on
- Resolve -- Close the incident as fixed
- View Monitor -- Navigate to the related monitor's detail page
If you resolve an incident while its monitor is still unhealthy, Pulse warns you before proceeding: resolving in this state immediately raises a new incident, and the comments and activity history of the current incident stay with it. The action button changes to Resolve anyway to confirm you want to proceed.
On mobile, the Acknowledge or Resolve action also appears as a full-width button pinned to the bottom of the screen for easy one-handed access. Tapping it opens a confirmation drawer before the action is carried out. If the monitor is still unhealthy, the confirmation drawer shows the same warning. The button disappears once the incident is resolved.
System Incidents
Pulse automatically raises system incidents when it detects operational issues that require administrator attention. These incidents appear in the same incident list as monitor-triggered incidents and trigger in-app notifications to all organization admins.
System incidents resolve automatically once the underlying condition clears — you do not need to resolve them manually.
| Incident | Cause |
|---|---|
| Email delivery failure | An SMTP server failed to deliver a notification email. |
| No one available for escalation | An escalation policy was triggered but no recipient could be reached. |
| No one on call for [schedule] | A configured on-call schedule has no coverage during active operating hours. |
| Gateway disconnected | The appliance lost its connection to the Pulse gateway and could not reconnect. |
| Gateway enrollment failed | The appliance has not completed gateway enrollment. This appears during first-boot setup and resolves automatically once enrollment is finished. |
| No valid license | The organization has no active license. Some features may be limited. |
| License expiring soon | The active license is close to its expiry date. |