
Dashboard
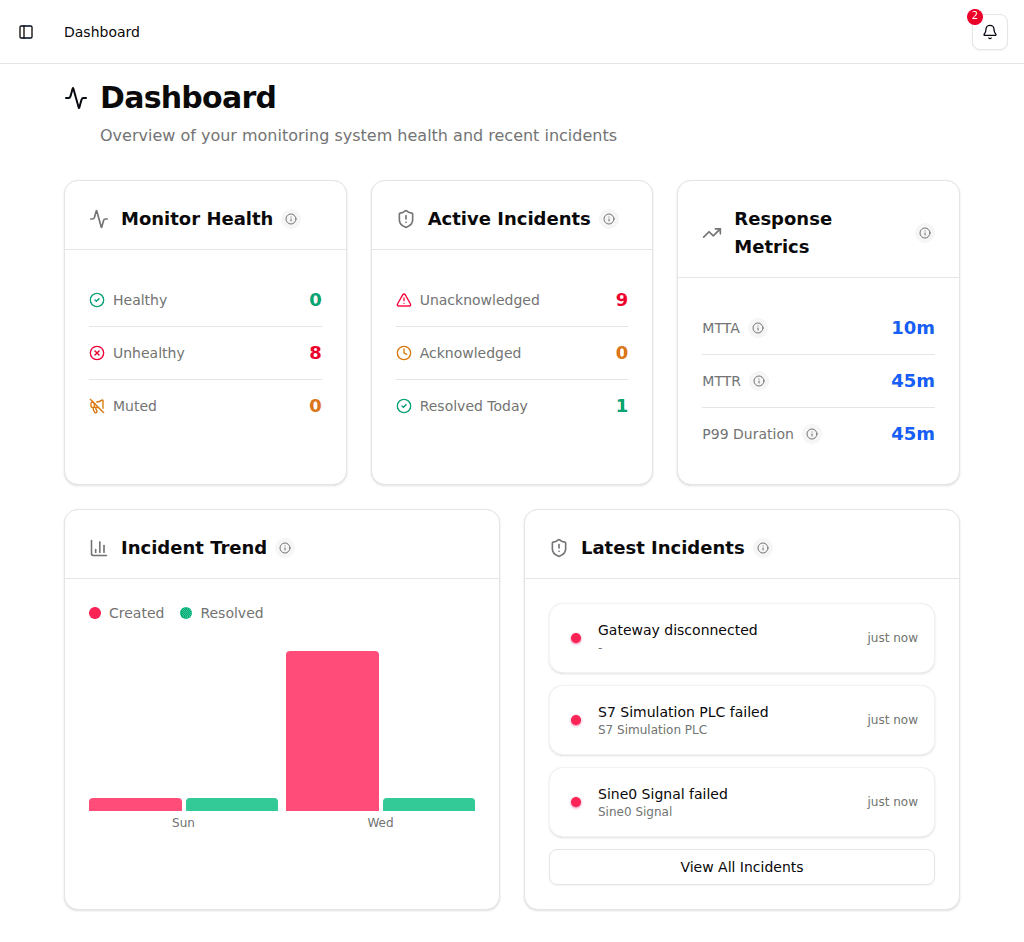
The dashboard provides a real-time overview of your entire monitoring infrastructure at a glance.
Monitor Health
The top section displays the current health status of all configured monitors:
- Healthy -- Monitors that are operating within expected parameters
- Unhealthy -- Monitors that have detected issues
- Muted -- Monitors that are temporarily silenced
Active Incidents
The incidents section shows the current state of open incidents:
- Unacknowledged -- New incidents that require attention
- Acknowledged -- Incidents that have been seen but not yet resolved
- Resolved Today -- Incidents that were resolved within the current day
Response Metrics
The dashboard tracks key incident response metrics over the last 7 days:
- MTTA -- Mean Time To Acknowledge: Average time from incident creation to first acknowledgment
- MTTR -- Mean Time To Resolve: Average time from incident creation to resolution
- P99 Duration -- 99th percentile incident duration
Incident Trend
A chart displays the trend of created versus resolved incidents over the past 7 days. This helps identify whether your team is keeping up with incoming incidents.
Latest Incidents
The bottom section shows the three most recent incidents with their current status, providing quick access to the most pressing issues.