

Monitors
Monitors are the core building blocks of Pulse. Each monitor watches a specific aspect of your OT infrastructure and creates incidents when problems are detected.
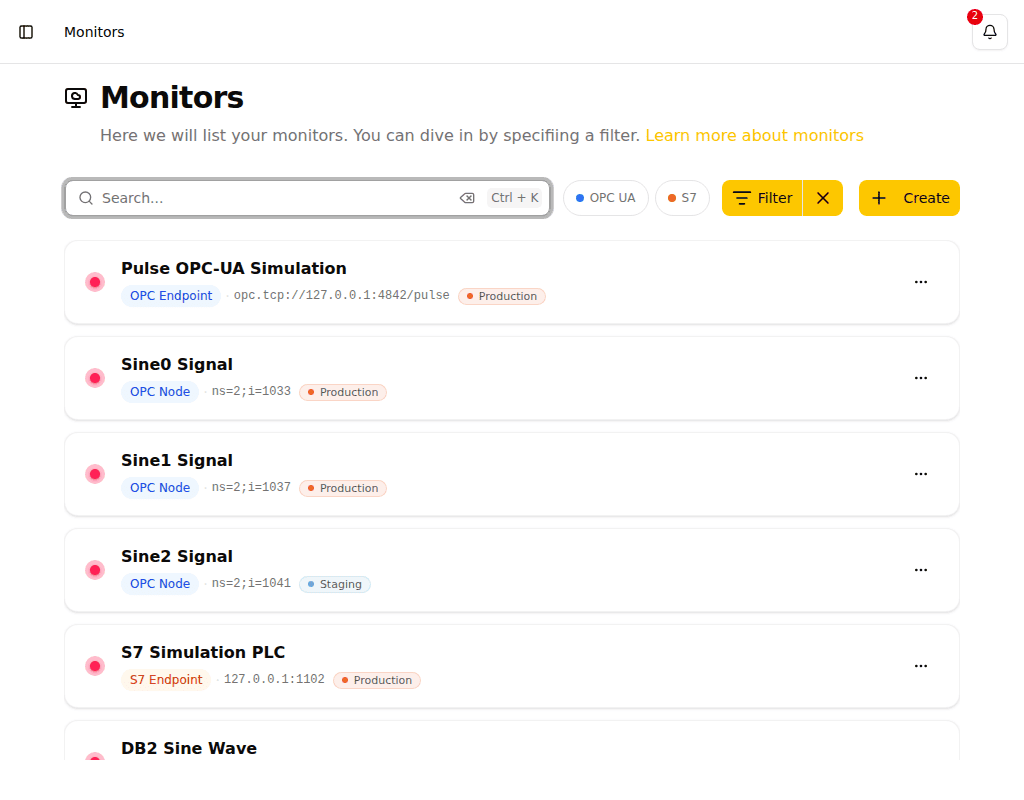
Monitor Types
Pulse supports several types of monitors:
Condition Monitor
Evaluates a condition — a visual expression built from data-point readings, monitor states, and logic nodes — and raises an incident when the expression is true. This is the monitor type you use to alert on anything Pulse reads from an OPC UA server, an S7 PLC, or a Prometheus endpoint.
Creating a condition monitor:
Go to Monitors → New monitor → Condition monitor. The create page collects the monitor's own fields alongside the condition:
- Name -- Display name for the monitor
- Escalation policy -- Which policy is triggered when the condition fires
- Tags -- Optional tags for categorization
- Condition -- Described inline using a sentence form (for the common threshold case), or you can attach an existing condition with Use an existing condition
The sentence form covers the everyday case — a reading that crosses a line. Anything beyond what the sentence can express links out to the full condition editor, which is also where you go to make changes afterwards.
If the condition already exists (for example, you want a second monitor with a different escalation policy on the same condition), use Use an existing condition to select it. The condition stays read-only on this path — changes to it are made in the editor.
Editing an existing condition monitor:
Open the monitor's detail page and click Edit. The edit form shows the monitor's current escalation policy and tags; the condition itself is shown read-only and opens in the editor from a link.
A single condition can back multiple monitors, each with its own escalation policy. The condition is evaluated every five seconds. The monitor state is set to Unhealthy when the condition fires, Healthy when it clears, and Unknown when data is absent or a window is empty. An unknown result leaves any open incident open — Pulse does not treat "no data" as an all-clear.
Adding an OPC UA or S7 data source creates one of these for you, named <source> unreachable, unless you untick the box while adding the source. It is an ordinary condition monitor from the moment it exists.
CVE Monitor
Tracks published Common Vulnerabilities and Exposures (CVEs) that affect a specific device. Pulse scans the security advisory catalog regularly and surfaces each matching CVE as a finding in the Vulnerabilities section, where you can triage it.
- Vendor -- Device manufacturer (e.g., Siemens)
- Order Code -- Device order number / MLFB used to match advisories (e.g.,
6ES7518-4AX01-0AB0) - Firmware Version -- Optional. Narrows matches to advisories that affect this specific firmware version.
A CVE monitor is shown as unhealthy while it has any finding that has not yet been triaged to a conclusive status. From the monitor's detail page, each matching finding links directly to its entry in the Vulnerabilities page via View finding.
INFO
CVE monitoring requires a license that includes CVE monitoring. If your license does not include this feature, the CVE Monitor create page shows an informational message. Contact your administrator to enable it.
Trigger Monitor
Receives inbound webhooks from external systems and raises incidents in Pulse. When you create a trigger monitor, Pulse generates a unique ingest URL. External systems POST any text or JSON payload to that URL; Pulse parses the payload with the rules you configure and creates, updates, acknowledges, or resolves incidents accordingly.
Basic configuration:
- Name -- Display name for the monitor
- Escalation policy -- Which escalation policy to use when an incident is raised
Payload parsing rules:
Each rule extracts a value or tests a condition from the incoming request body. Available modes are Regex (with optional capture group), JSONPath, and (for conditions only) Contains text.
- Alert ID -- Uniquely identifies an incident across multiple POSTs, enabling deduplication, acknowledgement, and resolution. When no Alert ID rule is set, every POST creates a new incident.
- Sending system -- Names the system a delivery came from, so that two senders sharing one ingest URL keep separate incidents even when they use the same Alert ID. Leave it unset if only one system posts to this monitor.
- Source timestamp -- Extracts the time the sending system says the alert fired (Alertmanager's
startsAt, a ticketing webhook'screated, and similar fields). Accepted formats are RFC 3339 with an explicit UTC offset, epoch seconds, and epoch milliseconds; anything else, including a value with no timezone, fails to parse. Shown on the incident timeline and in the delivery log -- see When the sender's clock disagrees with Pulse's below. Optional, and unrelated to Alert ID or Sending system. - Incident title -- Extracted text used as the incident title. Falls back to the monitor name when not set or no match.
- Incident description -- Optional extracted text stored as the incident description.
- Acknowledged when -- A condition that, when matched, acknowledges an existing open incident with the same Alert ID. Requires Alert ID to be configured.
- Resolved when -- A condition that, when matched, resolves an existing open incident with the same Alert ID. Requires Alert ID to be configured. Resolve is evaluated before acknowledge.
- Reset signal -- A condition that, when matched, closes every open incident this monitor still holds for the sending system that posted it. Requires a Sending system rule. Reset is evaluated before resolve and acknowledge, and a delivery that matches it is never also read as an alert.
Several systems behind one URL
One ingest URL is often handed to more than one system -- two plants, two clusters, several alert groups. Those systems tend to reuse the same generic Alert IDs (NodeDown, DiskFull, an alert name with no site label), and without a Sending system rule Pulse cannot tell two such reports apart: they share one incident, either system's resolve closes it for both, and whoever is on call sees one incident where there are really two problems.
Configure Sending system to extract something that differs per sender -- a site label, a cluster name, the alert group key -- and each sender gets its own incidents. The value is shown on the incident and in the delivery log, so a copy-pasted configuration that leaves the same value at two sites is visible rather than silent.
Add the rule while the monitor is quiet. Incidents that are already open were recorded before Pulse could tell the senders apart, so they belong to no sender -- and once the rule is in place, neither a resolve nor a reset from a sending system will close them. The editor warns you when the monitor is holding such incidents; resolve those by hand.
Pulse takes the sending system from the payload as it is given. It does not verify it: anyone who can POST to the ingest URL can claim to be any sender, and therefore reset another sender's incidents. The URL is the boundary that matters, and the sending system is bookkeeping inside it. If you need two systems to be unable to affect each other, give them separate trigger monitors -- separate URLs are the isolation, not separate sending-system values.
Letting a system start over
A system that restarts, is redeployed, or is reconfigured can lose track of what it already reported. Its incidents then stay open in Pulse forever, and the monitor stays red, because nothing will ever arrive to resolve them. The Reset signal is how an integration says "I have lost my state -- close what you still hold for me."
A reset closes only the incidents belonging to the system that sent it, and only ones that were already open when it arrived. Two things it deliberately leaves alone:
- Acknowledged incidents. Somebody is already working on those, so a reset does not take them away; they stay yours to close.
- Everything from other senders on the same monitor.
A reset is not an all-clear. The incidents close because the evidence for them is gone, not because Pulse saw anything recover -- a condition that is still physically true on the plant floor will be closed by a reset from the system that reported it. Because of that, these closes are recorded as their own kind of event on the incident timeline rather than looking like an ordinary resolution, and the delivery log shows how many incidents each reset closed.
Configure a reopen window alongside reset
A system that resets almost always re-posts whatever is still wrong immediately afterwards -- that is the whole point of a restart. What happens next depends on the reopen window of the escalation policy the monitor uses, which is zero unless you set it.
With a reopen window, each re-posted alert reopens the incident it closed moments earlier: the same incident, the same responder, the same position in the escalation, and nobody is notified again. Without one, the closes are final and every re-post starts a fresh incident that notifies from the beginning -- a reset of forty alerts becomes forty new pages.
The monitor editor warns you when a reset rule is configured on a policy with no reopen window. See Escalation Policies.
When the sender's clock disagrees with Pulse's
Pulse reports on when it heard about an alert, not on when the sender says it happened. Escalation timing, SLAs, incident durations, and every report all run on the moment the delivery arrived -- Pulse's own clock, always. A Source timestamp rule does not change that; it adds the sender's claim as extra evidence alongside it, never in place of it.
When configured, the value appears on the incident timeline labelled Reported by sender, next to the delta to when Pulse actually received it -- for example, "Reported by sender: 14:03, 4 minutes before Pulse received it." If a later delivery for the same alert carries a different value than the one already recorded, that change gets its own timeline entry, so a sender correcting itself or drifting mid-incident is visible rather than silently overwritten.
A large or negative delta -- the sender claiming a time after Pulse's own receipt -- almost always means the sending system's clock is wrong, not that Pulse missed something. Pulse shows that delta as-is rather than hiding or clamping it, because catching a broken sender clock is the point of showing the value at all.
The rule only ever affects the incident it raises or reopens; a value that is absent or fails to parse simply leaves the alert untouched with no source timestamp recorded -- it never blocks the delivery the way a misconfigured Alert ID rule can.
Request headers:
You can require one or more HTTP headers on every inbound POST. All configured headers must match for Pulse to accept the request — a missing or non-matching header returns a 401. This lets you put your own shared-secret authentication in front of the ingest URL (e.g., require X-API-Key: your-secret). Match modes are Equals, Contains text, and Regex.
Ingest URL and delivery log:
The monitor's detail page shows the ingest URL with Copy and Rotate URL buttons. A Last delivery timestamp shows when the most recent webhook was received; if nothing has arrived yet it reads No delivery received yet. Rotating the URL immediately invalidates the old one — update any systems that POST to it.
Incoming webhook deliveries appear in the activity feed alongside state-change events. Each delivery entry shows the outcome (incident created, updated, acknowledged, resolved, ignored, incident reopened, or reset), the extracted Alert ID, the sending system where one was read, and a Details button. A reset entry shows how many incidents it closed instead of linking to a single one. Opening Details shows the full payload as it arrived, the content type, a formatted view where applicable, and a direct link to the associated incident. If several deliveries arrive in quick succession they are collapsed into a single entry — click Show all N to expand the group. A notice at the bottom of the feed marks the point beyond which older deliveries are no longer retained.
TIP
Treat the ingest URL as a secret. Anyone who has it can POST to your monitor. Use request-header matchers to add an extra layer of authentication.
Heartbeat Monitor
Watches a job that runs on a schedule -- a nightly backup, an hourly export, an edge device that reports in. The job calls a secret ping URL every time it finishes successfully, and Pulse raises an incident when the ping stops arriving. This is the only monitor type where Pulse waits instead of connecting, which makes it the right choice for anything Pulse cannot reach directly.
- Name -- Display name for the monitor, usually the job's name
- Expected interval -- How long Pulse waits for a ping before raising an incident (minimum 1 minute)
- Escalation policy -- Which escalation policy to use when the ping stops
The ping URL is a secret: anyone who has it can fake a heartbeat. The ping must run after the job and only when the job succeeded. See Heartbeat Monitors for the full walkthrough, including how to wire it into cron without silently defeating the monitor.
SLO Monitor
An objective is itself a monitor: it carries an escalation policy, tags and a mute switch, and pages somebody when its error budget is burning too fast. It lives in the Objectives section rather than in this list — the burn-alert ladder sits beside the promise it watches. See Objectives → Being told about it for the full setup guide.
Conditions
Conditions are reusable graphs that express the logic for when a monitor should alert or measure a promise. Each condition is a directed acyclic graph of typed nodes — data points, aggregations, comparisons, logic gates, and one or more output nodes — that Pulse evaluates against live data.
The Conditions entry at the bottom of the sidebar, beside Tags and Severities, opens the conditions list at /conditions. It sits there rather than under Monitors because a condition is mostly the monitor's editing surface — you reach one by opening the monitor that alerts on it; the library is for the case where several monitors, or an objective, share the same condition.
Each row in the list shows:
- A status dot reflecting the condition's current verdict — Not holding (red), Holding (green), Unknown, Stale (not being evaluated), or Never evaluated
- When the condition was last updated
- How many data points, monitors, and objectives use it
- An Actions menu (the
⋯button) with shortcuts to open the condition, jump to the monitors that alert on it, open the objectives about it, or delete it
Use the State filter to narrow the list to conditions in a specific verdict, or the Used by nothing toggle to find conditions that no monitor or objective currently references. Administrators can create a new condition with New condition or delete an existing one. A condition cannot be deleted while a monitor is alerting on it or an objective is promising about it; remove those first.
Clicking a condition's name opens its graph in the condition editor. From the editor you can:
- Build or modify the node graph on the canvas
- Preview how the condition would have fired over a past time range (Preview mode)
- See the appliance's current live evaluation of the stored graph (Live mode)
- Save the condition and optionally attach or update a monitor
Condition editor layout
The editor has three main areas arranged left to right: the Palette (node types you drag onto the canvas), the canvas itself, and the Inspector (properties and issues for the selected node).
You can collapse either side panel to give the canvas more room. Click the toggle at the edge of the Palette or Inspector to fold it down to a narrow strip; click the strip again to restore it. The editor remembers which panels you had open or closed, so your layout is restored when you return — this is stored per browser and does not follow you to another machine.
The preview panel at the bottom shows data point charts for the time range you select. You can drag its top edge to resize it. The height you set is also remembered per browser and clamped to fit the window whenever you open the editor on a different screen.
Preview vs Live — A toggle in the timeline panel switches between two value sources:
- Preview — Backtests the current draft over the selected time range. This is the default; it answers "would my change fire?".
- Live — Reads the appliance's current evaluation of the saved graph in real time. Use this to see what the condition is actually doing right now. Live values are not available for an unsaved condition or while the draft has unsaved changes; save first.
When Live is active, a badge in the top-right of the canvas labels the node values as live so they are not mistaken for backtest results.
Condition editor on a phone — The editor is a desktop workspace and is not available on phones. Opening a condition editor URL on a narrow viewport shows a read-only view instead: a Graph tab with the condition canvas (pan and zoom, no editing) and a Details tab with the current live evaluation of each node. Creating a new condition requires a desktop browser.
Unreadable saved graph — If the stored graph of a condition cannot be opened (for example, because it was saved by a newer version of Pulse), the editor shows a banner explaining this. You can draw a new graph on the empty canvas and save it to replace the unreadable one.
Keyboard shortcuts — The canvas responds to keyboard shortcuts for selecting, editing, and navigating nodes. Press ? or click the keyboard icon in the canvas controls to open the shortcuts reference panel, which lists every gesture the canvas answers to.
Condition node types
The condition editor palette groups nodes into five categories:
Alerts & objectives — output nodes that give the graph meaning:
| Node | What it does |
|---|---|
| Alert | Raises an incident when its input is true. A condition can carry several named Alert nodes, each raising its own separately-named incident |
| Objective | Measures how much of the time its input holds, as a service level objective. Connect it to the same signal as the Alert node — or its inverse — so the promise and the page share one definition of "good" |
Sources — values that enter the graph:
| Node | What it outputs |
|---|---|
| Sensor | The live reading from a data point on one of your data sources, or that source's own reachability |
| Learned normal | The measured baseline statistic for a data point (see below) |
| Monitor state | True when a monitor is healthy or unhealthy |
| Constant | A fixed number or boolean |
Transform — numeric operations:
| Node | What it outputs |
|---|---|
| Aggregate | Min, max, average, sum, or count over a time window |
| Change over time | How much a data point's value has changed within a time window |
| Rate of increase | How fast a counter is climbing, per second, treating any drop as a counter reset |
| Math | Arithmetic on two numbers |
| Compare | True when a numeric comparison holds |
Chained aggregate windows add up
Each Aggregate node's window must stay within Pulse's hot-tier data retention period. When you chain aggregates (for example, an average over another average), the windows accumulate: an outer 24-hour average over an inner 24-hour average asks Pulse to read 48 hours of history. The editor flags the deepest node where the cumulative path first crosses the retention limit — shorten one of the windows in the chain to fix it.
Logic — boolean operations:
| Node | What it outputs |
|---|---|
| Gate (AND / OR) | True when all or any inputs are true |
| Not | Inverts a boolean |
| Sustained | True only after its input has held for a specified duration — use Continuously true to require the input stays true throughout the window, or True at any point to require it was true at least once |
Resilience — handling absent data:
| Node | What it outputs |
|---|---|
| Fallback | Substitutes a default when its input has no data |
| Has data | True when its input currently has data |
Condition node roles
Certain conditions — particularly those generated automatically by Pulse for anomaly-detection monitors — tag specific nodes with a role. A role identifies which node's value the incident description will quote by name when the condition fires (for example, "78.2 is above the upper limit of 76.0").
Three roles exist:
| Role | What it marks |
|---|---|
| Observed | The data point reading being compared |
| Upper limit | The computed upper bound |
| Lower limit | The computed lower bound |
A tagged node shows its role as a prefix in the card's summary line — for example, Upper limit · avg over 15 m. Selecting the node opens the inspector, which displays a Quoted in incidents as note confirming which role it carries. The role is set by Pulse when generating the condition; the editor carries it but does not let you change it.
Learned normal (baseline)
The Learned normal node reads the measured baseline for a specific data point — what Pulse determined the data point normally does over the last 14 days. This makes it possible to write conditions like "the reading is more than two normal spreads above the data point's normal level" without knowing the exact numbers upfront.
Each baseline node exposes one statistic at a time:
| Statistic | Meaning |
|---|---|
| Normal level | The data point's typical value (median) |
| Normal spread | How far the data point typically strays from its normal level |
| Normal low (1%) | The bottom of the data point's normal range |
| Normal high (99%) | The top of the data point's normal range |
| Normal movement | How much the data point typically moves within a few minutes |
| High movement | The upper edge of the data point's typical movement |
| Normal data coverage | The fraction of the window in which the data point normally has data |
The baseline is computed by the nightly measurement job described in Anomaly Detection. A data point added today will not have a baseline until the next nightly run; a node pointing at it reports Unknown until then.
Reading Quality
A condition monitor reports Unknown rather than Healthy when the readings it needs are missing or unreliable — for example because the PLC connection dropped or a value is no longer available on the server. An unknown verdict leaves an open incident open and pauses escalation; it resolves itself as soon as a valid reading arrives.
Where a reading has gone quiet is visible on the data source: its detail page shows each data point's last value, the time it was last read, and whether the last reading was Good, Bad, or No data. The source list shows the same at a glance — Reading, Not reading, or Awaiting first read.
Filtering Monitors
The monitor list supports several filter options:
- Status -- Filter by Healthy, Unhealthy, or Unknown
- Type -- Filter by monitor type (Heartbeat, CVE, Trigger, Condition)
- Tags -- Filter by custom tags assigned to monitors
- Escalation Policy -- Filter by the escalation policy assigned to the monitor
- Data source -- Filter by which data source the monitor reads from
- Stale data -- Show only monitors whose last reading is stale
- Muted only -- Show only monitors that are currently muted
- Search -- Text search across monitor names
A type chip row below the search bar shows each monitor type alongside its count. Click a chip to filter by that type; click it again to clear. A Tags button opens the tag picker directly — tags are the main way to slice the list, so they sit in the toolbar rather than inside the filter menu.
The sidebar's Monitors entry opens this list unfiltered. Under it sit shortcuts for the two types that behave differently enough to be worth their own entry: CVE Monitors and Trigger Monitors. Heartbeat and condition monitors have no shortcut of their own — they are the bulk of the list, found by tag or by the Type filter. Objectives are in the Objectives section; they are monitors underneath but live beside their burn-alert ladders, not here.
OPC UA and S7 no longer appear here. A connection is a data source now, so those entries moved to Data sources → OPC UA and Data sources → S7, which is also where the old monitor-list links take you.
On mobile, the filter controls are replaced by a Filter button that opens a bottom drawer. The drawer has sections for Status, Type, and Tags, plus standalone toggles for Stale data and Muted only. Tap Apply to activate the selected filters or Reset to clear all draft selections. Active filters appear as read-only chips below the search bar; to change a selection, open the drawer again.
Bulk Actions
Organization administrators can act on several monitors at once from the monitor list. Bulk selection is available on desktop only.
Click Select in the toolbar to enter selection mode. In the mode every row carries a checkbox and the whole row is the target — clicking a row selects that monitor instead of opening it. A Select all N monitors checkbox above the list selects or clears every row that matches the current filter, and holding Shift while clicking a row adds every row between the one you last clicked and this one, without dropping anything already ticked. Changing the filters clears the selection, because everything selected has to be a row still in front of you.
To leave selection mode, click Select again or press Escape. Escape unwinds one step at a time: the first press clears the selection, a second leaves the mode.
Once at least one monitor is selected, a floating action bar appears at the bottom of the list:
- N selected — how many monitors are currently selected
- Mute — mutes all selected monitors. A toast confirms how many changed state and offers Undo, which reverses only the monitors the action actually changed, so a monitor you had already muted stays muted.
- Unmute — unmutes all selected monitors, with the same toast and undo.
- Delete — opens the bulk delete confirmation dialog.
- × (Clear selection) — clears the selection without leaving the mode.
Bulk delete
Deleting monitors in bulk opens a confirmation dialog that counts the true number of monitors that will be removed. Selecting an S7 Endpoint or OPC UA Endpoint monitor also deletes all of its child monitors (S7 Tag or OPC UA Node monitors for that endpoint), so the dialog fetches those child counts before asking for confirmation. Type the displayed number to unlock the delete button.
If any selected monitors are used by conditions, the delete is blocked and the dialog lists which conditions reference them. You can remove those monitors from their conditions first and retry, or proceed immediately to delete the remaining unblocked monitors.
Monitor Details
Click on any monitor to view its detail page.
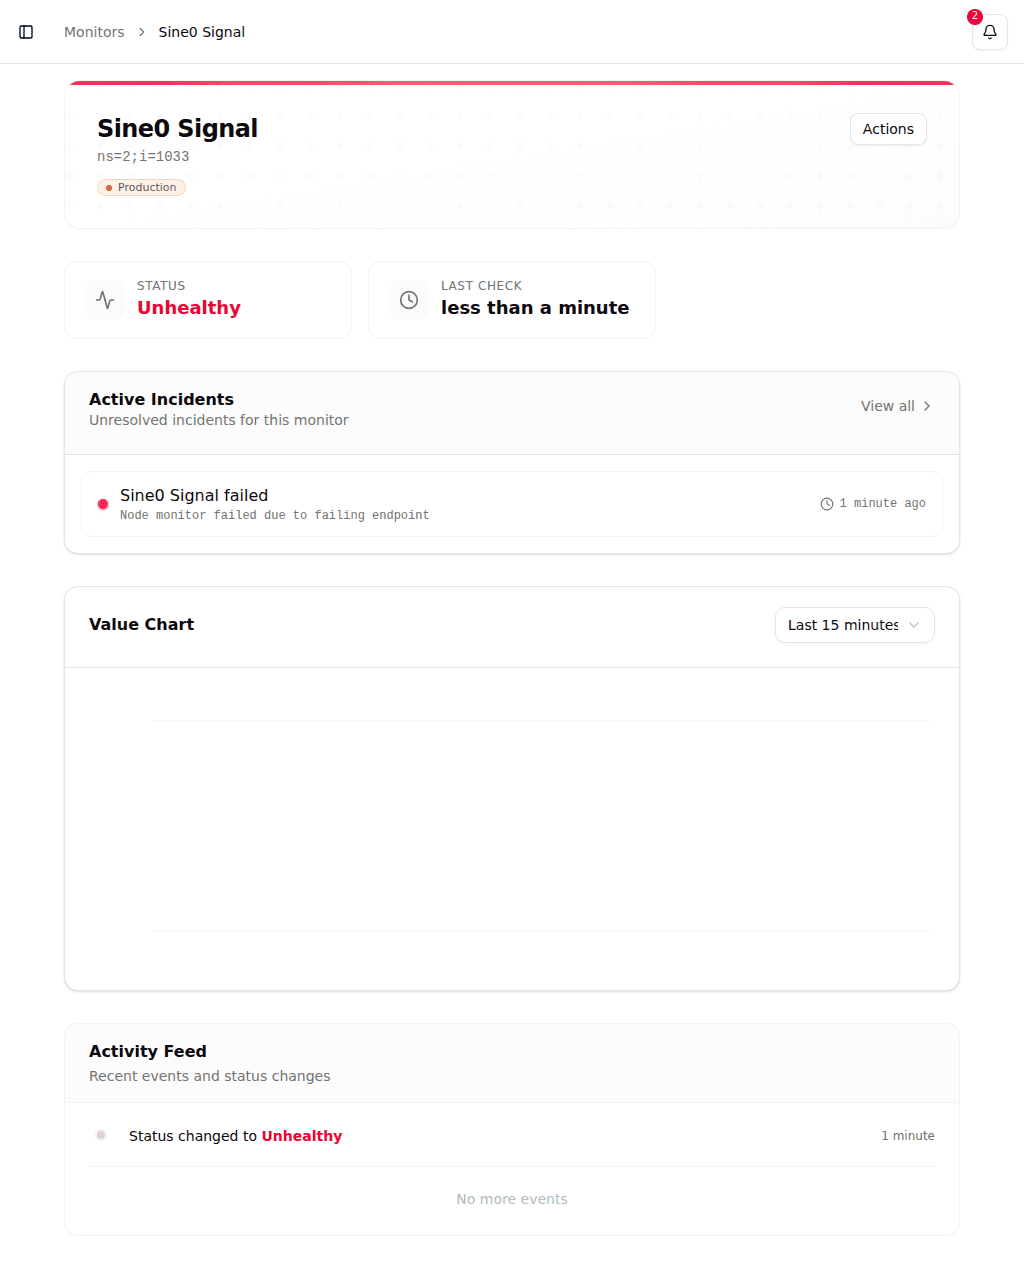
Every detail page shows:
- Status -- Current health status (Healthy or Unhealthy)
- Configuration -- What the monitor alerts on. For a condition monitor this is the condition itself, drawn as its graph; open it to edit. Because a condition can be shared by several monitors, it is edited where it lives rather than on this page.
- Tags -- Tags assigned to the monitor for categorization
- Actions -- Edit, mute, or delete the monitor via the Actions button
- Activity Feed -- a chronological history of status changes and events
Every monitor type has the Activity Feed, condition monitors included. When several monitors share one condition, each still has its own feed: they record the same status changes at the same moments, because that is what happened to each of them, and each monitor's own muting and unmuting appears only in its own feed.
Importing Monitors from CSV
Organization administrators can create CVE monitors in bulk from a CSV file. See Importing Monitors from CSV for the full walkthrough and the complete column reference.
Tags from Data Sources
A monitor carries its own tags, and you can filter the monitor list by them. Tags set on a data source are separate: they describe the machine rather than the alert, and every data point of that source inherits them automatically. Any condition monitor that reads one of those data points can be filtered by the inherited tags as well, so tagging a PLC once is enough to find everything that watches it.
Muting Monitors
You can temporarily mute a monitor to suppress incident creation during planned maintenance. Muted monitors continue to check their targets but will not generate new incidents.
TIP
Muting is useful during planned maintenance windows. Remember to unmute monitors after maintenance is complete.
Deleting Monitors
To delete a monitor, open its detail page, click Actions, and choose Delete. The confirmation dialog requires you to type the monitor's name before the delete button becomes active — this deliberate step prevents accidental loss of measurement history.
Deleting a monitor that is used by a condition is blocked. Remove the monitor from the condition first, then delete it.